Members
About this site
# Load the ggplot2 package
library(ggplot2)


# Create some example data
x <- 1:10
y <- x^2

# Create the plot
ggplot(data = data.frame(x, y), aes(x = x, y = y)) +
  geom_line() + theme(text = element_text(family = "Arial", size = 20))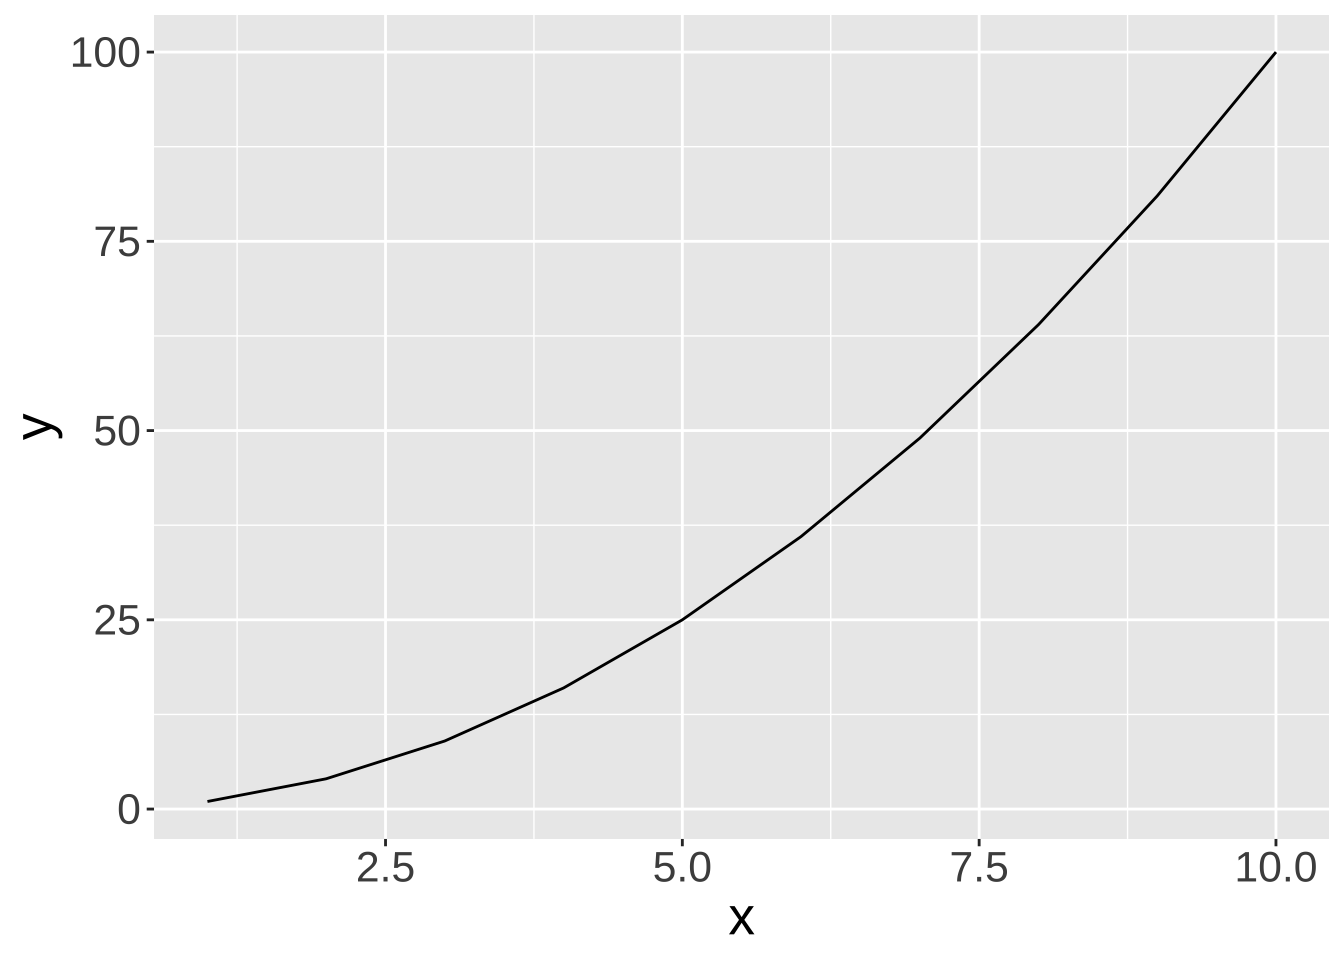
Who are we?
When the moon hits your eye
Wednesdays from 12:15 - 2:15 pm Mountain
Ketchum Arts & Sciences, Office 382, Boulder, CO 80309
Some text